Microsoft Excel ®
.
 Importing into Excel is not as straightforward, and there are a few more steps. Importing into Excel is not as straightforward, and there are a few more steps.
We have not found a way to establish a “template” for the data so that you can clear one race’s data and import different race files repeatedly into the same Excel worksheet. The best we have found is to save multiple copies of your data map (template) as separate worksheets and import each race file into a fresh copy of the template (instructions below). If you find a better way, please let us know!
We suggest you create a test folder for working with the files and copy some test files from the SpeedHandicapperV6 folder, then open them from Excel.
[Note that you can copy the file “SpeedSchema.XML” to your test folder and that this file is the schema for the saved race files. If you change the file extension from .XML to .xsd you can use this file as a data map in Excel. We tried this method and did not get the hoped for results (it imported all of the data, not just the mapped columns). If you want to look deeper into this, see the Microsoft® Office tech page.]
The following process is cumbersome, but does provide workable results in Excel:
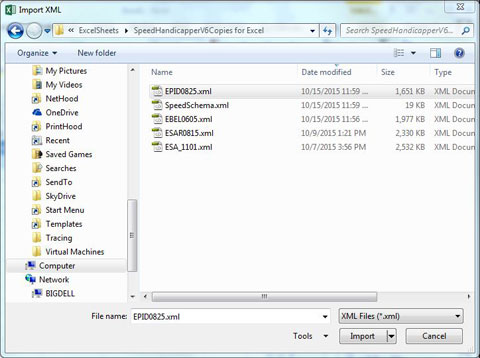
In your working folder, select any race card .xml file to open to create a data map. It doesn’t matter which because you are not going to fill the data map with data until after it is created a saved.
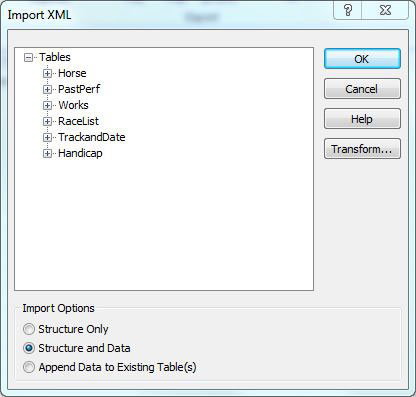
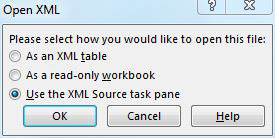
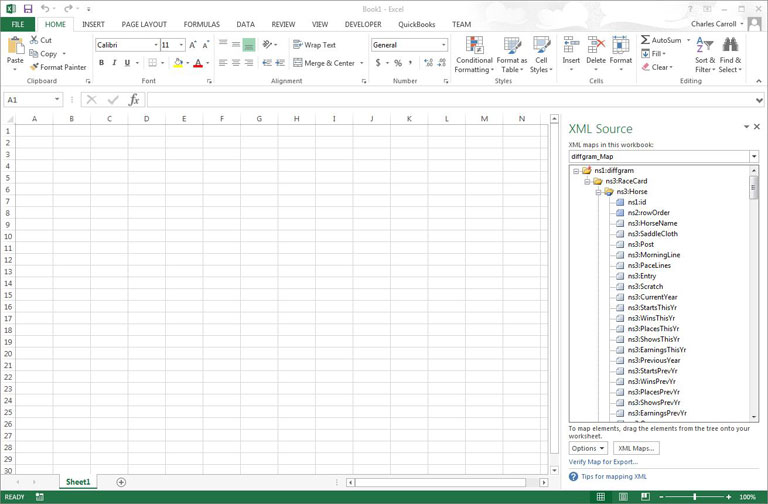
In the Open XML window, select “Use the XML Source task pane.”
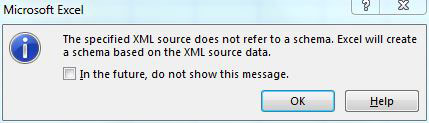
Click OK in the create schema message box.
You will now see all of the tables of the XML dataset and can expand them to see the individual fields (columns).
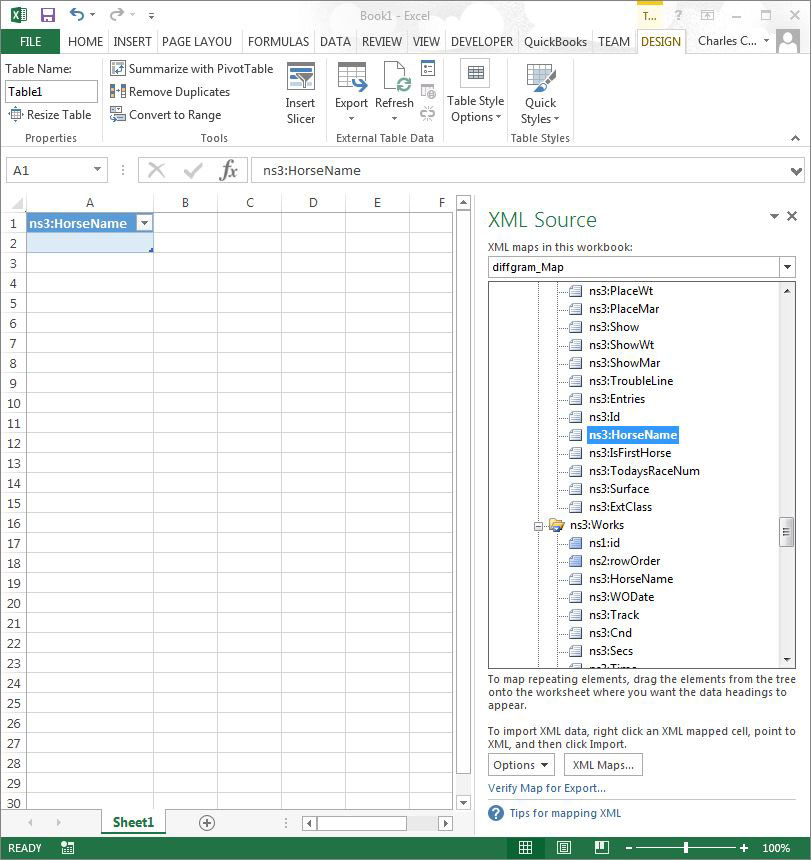
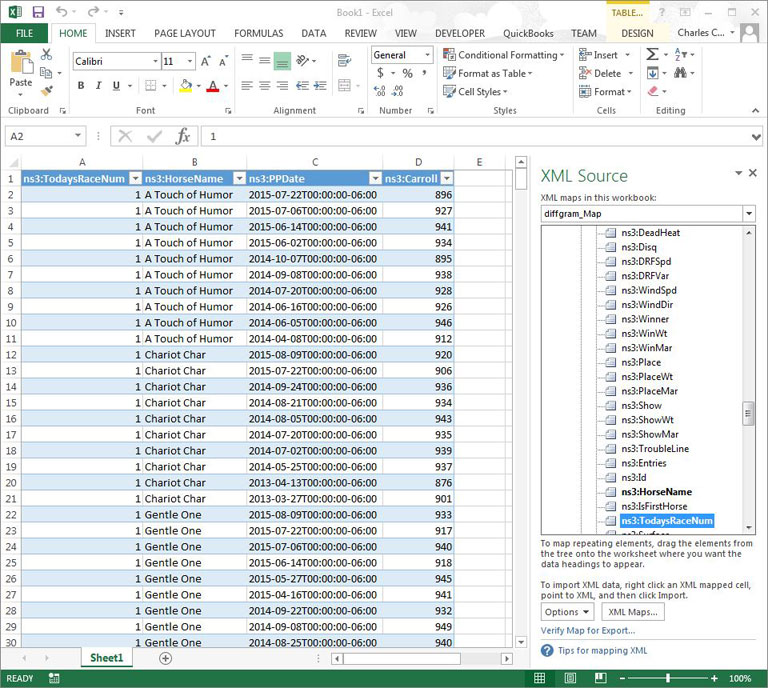
This is where it gets interesting…you have access to every field, which you can drag-and-drop to the top cell of a column of the spreadsheet on the left of the image below. Obviously you don’t want all the fields; what you probably want is what is contained in the handicap table, which you can click on to expand and see the fields. Note in the image below, we have scrolled down to highlight the “HorseName” field of the Handicap table as the first to drag to the spreadsheet.
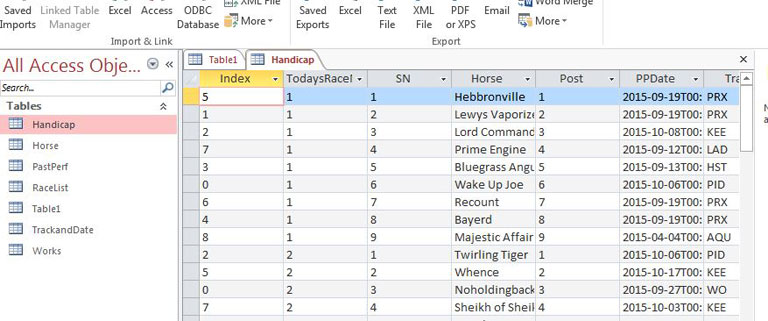
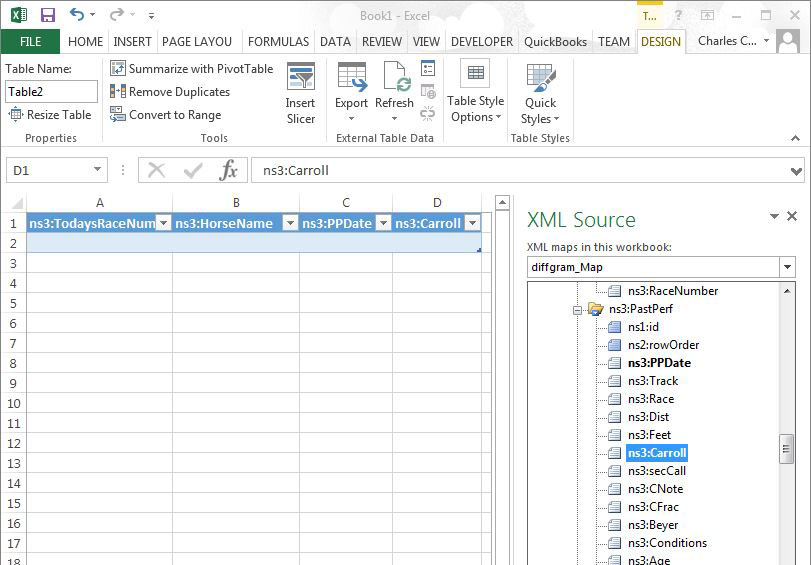
In the image below we have added additional column headings with TodaysRaceNumber in the first column.
 WHEN YOU HAVE ADDED ALL THE COLUMNS YOU WANT, STOP RIGHT HERE AND MAKE BACKUP COPIES OF YOUR DATA MAP. WHEN YOU HAVE ADDED ALL THE COLUMNS YOU WANT, STOP RIGHT HERE AND MAKE BACKUP COPIES OF YOUR DATA MAP.
[You may learn how to empty data from a datamap and reuse it with other race files, but right now we don’t know how. We have used backup copies of the datamap for each race file. If you do have the solution, please let us know!]
In a saved backup of your data map, put your curser in the cell directly below a column heading and right-click. This shows a menu. Scroll down to “Import” XML—this opens a File Open window again. Navigate to your folder of copied race .XML files and select Open. (See the first Excel image above of the File Open Window.) The columns you set up become populated as shown below.
You can do a “Save As” of your populated worksheet from here in Excel—using a new file name so you do not overwrite your data map template.
Hopefully, this information will get you started with your own work if you’ve been wanting to test ideas using Excel®.
If you are an Excel® power-user and know a better way, please let us know!
|